

- 1020.92 KB
- 2022-04-22 13:44:23 发布
- 1、本文档共5页,可阅读全部内容。
- 2、本文档内容版权归属内容提供方,所产生的收益全部归内容提供方所有。如果您对本文有版权争议,可选择认领,认领后既往收益都归您。
- 3、本文档由用户上传,本站不保证质量和数量令人满意,可能有诸多瑕疵,付费之前,请仔细先通过免费阅读内容等途径辨别内容交易风险。如存在严重挂羊头卖狗肉之情形,可联系本站下载客服投诉处理。
- 文档侵权举报电话:19940600175。
'中国科技论文在线http://www.paper.edu.cnAnecologicallybasedsystemforsustainableagroforestryin#sub-tropicalandtropicalforests11234SUNYuan,CAOFuliang,WELHAMClive,PELZR.Dieter,WEIXiaohua,56**5CHENLei,YANGQing(1.Co-InnovationCenterforSustainableForestryinSouthernChina,NanjingForestryUniversity,Nanjing210037;2.DepartmentofForestResourcesManagement,FacultyofForestry,UniversityofBritishColumbia,VancouverBCV6T1Z1;103.FacultyofEnvironmentandNaturalResources,UniversityofFreiburg,Freiburg79108;4.EarthandEnvironmentalScience,UniversityofBritishColumbia,VancouverV6T1Z1;5.ForestryCollege,NanjingForestryUniversity,Nanjing210037;6.CollegeofInformationScienceandTechnology,NanjingForestryUniversity,Nanjing210037)15Abstract:Forestsintropicalandsub-tropicalcountriesfaceseverepressuresduetoacombinationofpovertyandenvironmentdegradation.Tobeeffective,measurestoprotecttheseforestsmustthereforeconsiderbotheconomicandecologicaldimensionssynergistically.Thepurposeofthispaperwastosynthesizeourlong-termwork(1994–2015)onaGinkgoagroforestrysystemanddemonstrateitspotentialforachievingbothgoals,anddiscussitswiderapplicationintropicalandsub-tropical20countries.Theperformanceofvariousecological,economic,andsocialindicatorswascomparedamongfiveGinkgoagroforestrysystems.Twointegratedindicators,HarmonyDegree(HD)andDevelopmentDegree(DD),werealsousedtoshowtheintegratedperformanceoftheseindicators.Ginkgo-Wheat-Peanut(G+W+P)andGinkgo-Rapeseed-Peanut(G+R+P)arethebestsystemswhencomparedtopureandmixedGinkgoplantations,orpureagriculturalcrops.Resultsdemonstratethatit25ispossibletoachievebotheconomicdevelopmentandenvironmentalprotectionthroughimplementationofsustainableagroforestrysystemsinsub-tropicalregions.Keywords:ginkgobiloba;indicators;forestproducts;harmonydegree;developmentdegree0Introduction[1]30Forestsplayanimportantroleintheterrestrialcarbonbudgetandprovideessentialecosystem[2]services.However,forestcovercontinuestodeclineatanalarmingrate,bothinquantityandquality.[3]AccordingtotheFAO(2010),theworld’sforestsaredisappearingatanaverageof25ha/minute.Currently,forestsrepresentanetcarbonsourcemainlybecauseoflarge-scaledeforestationinthe[4]tropics.Forestquality,thegoodsandservicestheyprovide,isalsodeclining,largelyasaresultof[5]35mismanagementand,potentially,climatechangeimpacts.Theseproblemsindicatethatcurrentforestmanagementpracticesareunsustainableandthatalternativeconceptsandsystemsmustbedeveloped.Rootcausesofforestdeclineincludegovernancefailure,insecureforesttenure,povertyin[6]developingcountries,andalackofsustainableforestmanagementregulationsandpractices.Amongthesefactors,themostimportantmaybepoverty.Indevelopingcountries,wheremosttropicaland40sub-tropicalforestsarelocated,peopleareoftenverypoorandprotectionoftheenvironmentissecondarytomeetingbasicsurvivalneeds.Thissuggeststhatnoforestmanagementsystemswillbesuccessfulunlessecologicalandeconomicfactorsareconsideredsynergistically.Agroforestryisalandusemanagementsysteminwhichtrees,shrubsandcropsarecultivatedon[6,7]thesamepieceoflandtogenerateenvironmental,economicandsocialbenefits.Ithasbeen45practicedinmanycountriesformillennia.StudieshavedemonstratedthatagroforestrysystemscanFoundations:thespecializedresearchfundfordoctoralprogramsinChina(20133204130001);thegeneralfinancialgrantfromtheChinaPostdoctoralScienceFoundation(2016M601822).Briefauthorintroduction:SUNYuan(1976-),female,Associateprofessor.SustainableForestManagement,LaserScanforForestInventoryCorrespondanceauthor:CAOFuliang(1957-),male,Professor,Academician,ChinaAcademyofEngineering.E-mail:cao@njfu.edu.cn-1-
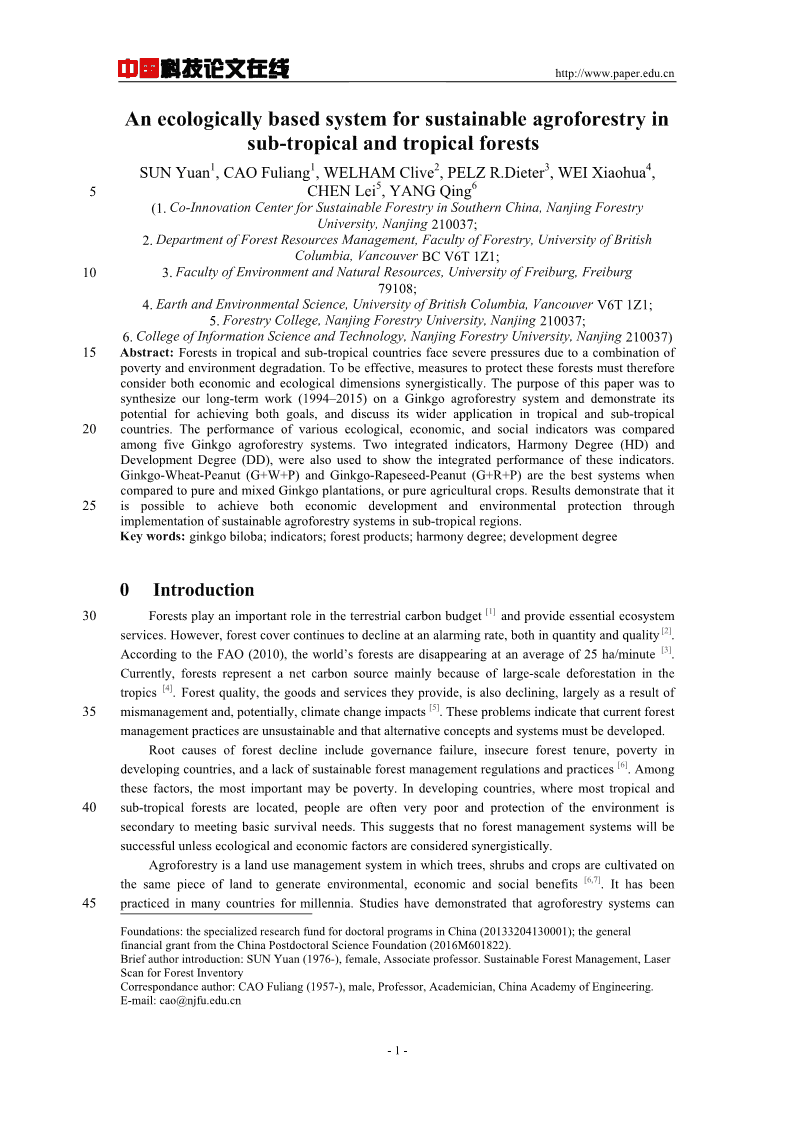
中国科技论文在线http://www.paper.edu.cn[8,9][10][11,12]significantlyincreaselandproductivity,enhanceeconomicbenefits,improvesoilnutrients[13,14][15,16]andbiodiversity,andincreaseemployment.Thesemultiplebenefitsarerealizedduetopositiveinteractionsamongthevariousspeciescombinationsandefficientresourceutilization.Moststudies,however,havefocusedononlyoneorafewaspectsofagivenagroforestrysystem,andlittle50hasbeendonetotakeanintegratedandquantitativeapproachtoexamineabroaderrangeofecological,economicandsocialbenefits.Ginkgo(GinkgobilobaL.)isnativetoChinaandisanimportantspeciesinChineseagroforestry.Itisplantedthroughoutthecountry,butespeciallyinthecentralforestedplainsregion.InPizhoucounty,JiangsuProvince,forexample,thetotalareaofGinkgoplantationin2016wasabout30,000255hm.Ginkgonormallyproducesitsfirstfruitat8~10yearsold,andisestablishedatawidespacingtoachievemaximumyield.ThisfeatureprovidesanopportunitytointermixGinkgowithagriculturalcrops.Withcarefulmanagement,itispossibletorealizebothshort-termbenefitsfromagriculturalproductswhilederivinglonger-termbenefitsfromtheGinkgoitself.ManykindsofagroforestrypracticeshavelongbeenappliedtotheGinkgoplantationsinChina.Thisrichhistoryandabundant60researchprovideagoodopportunitytoconductanintegratedandquantitativeassessmentofdifferentapproachesasaguidetoimprovedmanagement.Ginkgoforestsarevaluableeconomicallybecausealmosteverybiomasscomponentcanbeprocessedintoahigh-valuecommodity.Traditionally,ChinesepeoplehavegrownGinkgofor[17,18]medicine,fruits,andvisualquality.Itcanbegrowninpureormixedstandswithvarioustreeor65cropspecies.Therehavebeennumerouslong-termstudiesondifferentGinkgoagroforestrysystems[8,11,19,20,21].Forexample,Cao(2007)evaluatedcombinationsofGinkgo,Wheat(TriticumaestivumL."FengShouNo.2"),Rapeseed(BrassicanapusL.),andSoybean(GlycinemasL.)atdifferentplanting[19]densities,anddevelopedaconceptualmodelofthetradeoffsbetweenGinkgoandfoodcropvalues.Cheng(2010)evaluatedtheecologicalimpactsonmicro-climate,photosynthesis,soilfertility,nutrition[8]70andbiologicalproductivityamongsevenGinkgoagroforestrysystems,whileTian(2012)analyzed[21]thephysiologicalandecologicalimpactsofGinkgo-teaagroforestry.ThemainpurposeofthisstudywastocomparevariousGinkgoagroforestrysystemsintermsoftheintegratedperformanceofecological,economicandsocialindicators,anddemonstratetheirpotentialinachievingpovertyalleviationandenvironmentalprotection.Wealsodiscusstheirwider75applicationtoothertropicalandsub-tropicalforestregions.First,publisheddatafrompreviousstudiesovertheperiod1994to2015arecompiled.Wethenapplyanintegratedassessmentsystemdeveloped[22]bySun(2011)tocomparethevariousagroforestrysystems.Finally,thepotentialbenefitsofapplyingthemostsuccessfuloftheGinkgoagroforestrysystemstotheentireJiangsuProvince,China,areforecasted.Supplementaldatafromotherstudieswereincludedtoenhancetherigorofthe80assessment.1MaterialsandMethods1.1StudyareaandexperimentaldesignAlong-termGinkgoexperimentalsiteislocatedintheTaixingexperimentalgarden,Taixing85city,China(32°06´N,120°04´E).Thesitehasacontinentalmonsoonclimatewithmeanannualtemperatureof14.9℃,andameanof27.6℃insummerand2.0℃inwinter.Averageannualrainfallis1031.8mmandthefrost-freeperiodis229days.Threetraditionalagroforestrysystems,Ginkgo-Wheat-Peanut(G+W+P),Ginkgo-Rapeseed-Peanut(G+R+P),andGinkgo-Mulberry(MorusalbaL.)(G+M)weresubjecttoanalysis.Inaddition,pureGinkgo(G)andtraditional90agriculturewithWheat-Peanut(W+P)rotationswereincludedinthecomparisons(Figure1)(Cao,2012).IntheG+R+PandG+W+Pmodels,Ginkgoistheoverstoryspecies,withrapeseed,wheat-2-
中国科技论文在线http://www.paper.edu.cnandpeanutsowedandharvestedalternately,dependingontheparticularsystem.Anadditionalbenefitofpeanutisitsabilitytofixnitrogenandthushelpmaintainsoilproductivity.TheG+Mmodelisaperennialmulti-storyagroforestrysystemwithahighefficiencyandhighyield.95Thestudyemployedacompletelyrandomizeddesignofthefivetreatments,with3-5replicatespertreatment(foratotalof20treatment×replicatecombinations).Eachcombinationoccupieda0.5hasite,andin1994,eachsitewasrandomlyassignedona10hagridlaidoutonanareaofrelativelyuniformtopography.Siteswereconvertedfromtraditionalfarmland(comprisedoftheW+Pcombination)toGinkgoagroforestry;inoneareatheW+Protationwasretained.TheGinkgotrees100wereplantedataspacingof8m×8m.By2008,theGinkgohaddiameteratbreastheightof18.5-31.2cm,aheightof5.7-7.6m,anda6.0-7.8mcrownwidth.GinkgoplantMulberryplantcropscropscropscropsscropscrops105a.Ginkgoandcropsmixedmodelb.GinkgoandMulberrymixedmodelG+MG+W+PGG+R+PW+P110Fig.1FiveGinkgoexperimentalsystems:G+M,G+W+P,G+R+P,GandW+P(seetextfordefinitions)Mulberriesweresownin1994,ata0.3m×1mspacing.LeaveswereharvestedeachJuneandabovegroundgrowthprunedbackinNovember.WheatandrapeweresowninlateOctoberorearly-1-1Novemberat90-100kgha(wheat)and4-6kgha(rape),respectively,andharvestedinlateAprilor115earlyMayofthefollowingyear.Thelandwasthenimmediatelytilledandseededtopeanuts(120-130-1kgha).ThepeanutswereharvestedinSeptemberandthecyclerepeated.Allsystemshadthesamefertilizationandtillageschedule.Fertilizerwasappliedat375kg/haNPKfertilizer(10:7:8)twiceperyear(MayandNovember).-3-
中国科技论文在线http://www.paper.edu.cnDatafromthefiveexperimentalsystemswerecollectedeveryfiveyears,startingin2004(2004,1202009and2014).1.2Dataandselectionofindicators[23][22]ThispaperusedtheGinkgoPlantingExpertSystem(GPES)andaquestionnairemethodtoselectsuitableindicatorsforassessingandcomparingdifferentGinkgoagroforestrysystems.Thisisdescribed,asfollows.125Toselectpotentiallyrelevantandrepresentativeindicators,weusedseveralcriteria.First,theindicatorsshouldhaveahighfrequencyofoccurrenceinthescientificandresourcemanagementcommunities.Second,theymustberelatedtothemanagementgoalsofagroforestrysystems.Third,theselectedindicatorsshouldinformatleastoneofthethreecomponentsofsustainability,Environmental,Economic,orSocial.Fourth,eachindicatorshouldbeeasytomeasure,interpretandrecord.The130selectionofexpertsisacrucialelementindecidingwhichindicatorsareimportantforanalysisbecausedifferentindividualswouldlikelyhavewidelyvaryinginterestsandpriorities.Twoexpertteamswerethereforeutilized,onecomprisedofacademicresearchersandtheotherofmanagementstaffandpractitionersfromthelocalregion.Allteammemberswerevettedtoensurethey:1)werewellinformedintermsoftheagroforestrysystems;2)hadagoodunderstandingofsustainableagroforestry135management;and3)wereknowledgeableaboutGinkgoecologyfortheregioninwhichthemanagementplotsaresituated.PleaserefertoAppendixBformoredetailsregardingtheGPESandthequestionnaireform.AlistofindicatorswasderivedusingtheAnalyticalHierarchyProcess(AHP)andDelphimethod[24],whichfocusesonaquestionnaireanditsrelationshiptoindicatorselection.Indicatorswere140requiredtohavethefollowingcharacteristics:Flexibility-theyshouldbeapplicabletoalltypesofforestsintheagroforestrypractices;Feasibility-theyshouldbebasedonreadilyavailabledata/ortheyshouldbeeasilymeasurablebyavailabletechniques;Applicability-theyshouldbepracticalandnotrequireexcessiveadministrativeworkloads,andbecost-effective;andAdaptability-theyshouldbeadaptabletoprevailingsocial,economic,politicalandenvironmentalconditions.Thequestionnaire145analysisincludedanassessmentofreliabilityusingCronbach"salphainternalconsistency,data[22]selectionandclusteringmethod.Table1showsthefinallistofselectedindicators.Tab.1SelectedindicatorsforassessingandcomparingdifferentGinkgoagroforestrysystemsEcologicalEconomicSocial-2-1TheannualaveragetemperatureIncome(ThousandYuan·hm·a)Landequivalentratio(LER)-2-1-2-1Annualsoilerosion(t·hm·a)NetIncome(ThousandYuan·hm·a)Opportunitiesofemployment(10thousand-1Yuan·a)Soilfertilityqualityindex(FI)ThepaybackperiodofinvestmentTherateofagriculturalproducts(Ic=0.1)*LitterdecompositionrateNetpresentvalue(NPV)(Ic=0.1)Valueofgoods(10thousandYuan)TotalplantproductivityTheinternalrateofreturn(IRR)Diversityofproducts-2-1(kg·hm·a)*Iisbenchmarkyieldc1501.2.1EcologicalindicatorsAverageannualairtemperaturereflectstheabilityoftheforesttoregulatetemperatureextremes.Ingeneral,moredenseforeststandswithlargerleafareaindexandmultiplelayershaveagreaterabilitytobufferairtemperaturechanges.Annualsoilerosioniscommonlyusedto[11]indicatesoilstability.Agroforestrysystemshavethepotentialtosignificantlyenhancesoil[25]155qualityandlong-termsoilproductivity.Fertilitychangesreflecttheinteractionofthechemical,[26]physicalandbiologycomponentsinthesoil.Soilqualityindexwaschosentoindicatethegeneralpositiveenvironmentaleffectsofagroforestrysystems.Litterdecompositionratesare-4-
中国科技论文在线http://www.paper.edu.cnindirectindicatorsofforestproductivity,whiletotalplantproductivitydirectlyreflectsthe[8]integratedeffectofallsiteconditions.1601.2.2Economicindicators-2-1Totalincome(10,000yuan·hm·a)isthetotalvalueofbothforestandagricultureproducts.-2-1Itiscalculatedfromyieldandassociatedunitprices.Netincome(10,000yuan·hm·a)istheannualtotalincomeafterdeductingannualexpenditures.Thelatterincludescapitalspendingandlaborcosts.Capitalspendingcostsareforpesticides,fertilizers,andseedforunderstoryplants.165Laborcostswerecalculatedusingthenumberofworkingdaysandanaveragedailysalary(40-1yuan·d).Thepaybackperiodofinvestment(Ic=0.1)iscalculatedasfollows:"Ptt()COCItc(1I)0t0"PWhere,tisthedynamicinvestmentpaybacktime;COiscashoutflowandCIcashinflow,inI170yeart;andcisthebenchmarkyield;theyieldissetat10%.Netpresentvalueisoneofthemostimportantindicatorsforthedynamicevaluationofinvestmentprojects,andisthealgebraicsumofpresentvaluethatcomesfromnetfloweachyear,discountedtothestartofinvestmentaccordingtoabenchmarkyieldordiscountrate.Thecalculationformulais:ntNPV()COCItc(1I)175t0[27]Wherenisgivenperiod.In1980,thelandtransferperiodinTaixingwassetat50years.SofartheGinkgoplantation,plantedin1993,thetotalcalculationperiodinthisstudyis37years.Theremainingtermsarethesameasinthepaybackperiodofinvestmentcalculation.Theinternalrateofreturn(IRR)isthediscountratewhennetpresentcashfloweachyear180equals0duringthegivenperiod,showingfutureprofit.Thecalculationformulais:nt()COCIt(1)IRR0t01.2.3SocialindicatorsLandequivalentratio(LER)reflectslandutilization,andreferstotherelativeweightofdemandforlandvaluewithinthemixedmodeandmonoculture.LERis:nPnLER185i1MnwherePisproductionofthenthcropunderthemixedmode,whileMisproductionofthenthcropundermonoculture.Opportunityofemployment(seeTable1)istheamountofmoneyavailabletoemployalaborforce.Therateofagriculturalproducts(Table1)isthepercentageofcommercializedagricultural190productsinrelationtototalproduction.Itisanimportantindicatorforthetransformationofmaterialsfromsubsistenceproductiontoanactualsaleablecommodity.Valueofgoodsisdefinedasthevalueoftotalproductionminusconsumptiveuse.Diversityisthenumberofdifferentproductsthatcanbegenerated.-5-
中国科技论文在线http://www.paper.edu.cn1.2.4Integratedindicatorsmodelsandanalysis195Theintegration(synergy)ofecological,economicandsocialaspectsofsustainable[28][29]managementcanoccuratthedecision-makinglevelorviamechanisticmodeling.Haken[30](1971)describedthetheoryofsynergyasacomplexsystemmadeupofsmall,simpleunitsconnectedtoeachother,andexhibitingself-organization.Phase-changewithinasystemdependsonexternalcontrolparameters(environment,energy-fluxes),whilethestructureandwhichchange[31]200sequencethesystemexhibits,dependonthesynergyoftheinteriorparameters.Weusedtwoindicators,HarmonyDegree(HD)andDevelopmentDegree(DD),asmeasuresofintegrationamongthethreesubsystems(ecological,economicandsocial)andtoassesssustainability(see[22]Sun,2011,forfurtherdetails).HDreferstoconcordanceandbalanceofeachparameterindifferentsubsystemsandineachhierarchy,andisthusameasureofthesynergyofasystem.A205synergeticevaluationofthethreesubsystemswasconductedasfollows:nXf()xiif()xSocialsustainability:i1,jisameasureofindicatorsinsocialaspect,ni1whereiistheweightfortheithindicator,i1.mYf()yjjf()yEconomicalsustainability:j1,jisameasureofindicatorsinmj1economicalaspect,wherejistheweightforthejthindicator,j1kZf()zttf()z210Ecologicalsustainability:t1,tisameasureofindicatorsinecologicalkt1aspect,wheretistheweightforthetthindicator,k1Thethreesubsystemsaregivenequalweightsinallsubsequentanalyses.Thisreflectsthefacteachisequallyimportantfortheagroforestrysystemsasitrelatestotheoperationalobjectivesforthecasefarm.AgeometricrepresentationoftheHDasanequilateraltriangleisshownin215Figure2,andtheindexofharmonyinTable2.Valuesforeachsubsystemareplottedonthecorrespondinglocationsalongtheedgeofthetriangle.Thecentroidfromtheresultingtriangleis[22]thenfoundanditconstitutestheHDvalue(see).-6-
中国科技论文在线http://www.paper.edu.cnFig.2Equilateraltriangleofthethreesustainabilitysubsystems,ecological(Ec),economic(E),andsocial(S).220Concentriccirclesrepresentthedifferentcombinationsofthesubsystems,whichgivesrisetovariationintheHarmonyDegree(HD)index.TheHDindexvariesfrom0to1.Tab.2IndexanddegreeofHarmony(HD)DegreeNoSignificantModerateMildBasicModerateHighExcellentcontrolDisorderDisorderDisorderHarmonyHarmonyHarmonyHarmonyIndex≤0.290.3~0.390.4~0.490.5~0.590.6~0.690.7~0.790.8~0.9>0.9225HDrepresentsthedegreeofharmonywithineachsubsystemandhowtheyinteracttoinfluencethesystemasawhole.Itis,however,astaticmeasureanddoesnotprovideinsightintothedegreeofsystemdevelopment.Asystemwithhighharmony,forexample,couldhavelowdevelopment.Thedegreeofdevelopment(DD)isrepresentedinathree-dimensionalCartesiancoordinatesystem,whereX,Y,Zrepresentsthestandardizedvaluesforthethreesubsystemsatagivenpointin230development(Figure3).Theidealpointinthespaceliesalongthediagonalline,OS,thoughinmostcases,thelinewillbeorientedelsewhereinthespace(OS1,orOS2,forexample;Figure3).Accordingtostatisticaldata,theassessmentresultforsubsystemsshouldnotbelessthan0.2in3manycases,soastartingpointisgivenasX=Y=Z=0.2,thenDD==0.346.Thispointisasplit5point.Ifotherpointsarelowerthanit(whichmeansthatallthesubsystemsareinthelowestlevel),235thenitisnotnecessarytoconsidertheharmonydegreeamongthem.TheindexfordevelopmentdegreeisdescribedinTable3.222DDXYZ-7-
中国科技论文在线http://www.paper.edu.cnFig.3DevelopmentDegree(DD)asreflectedinaCartesiancoordinatesystem.DDisthelengthofthelinefrom240theorigintothepointofintersectionintheX,Y,Zspace(seetextformoredetails).Tab.3Indexanddegreeofdevelopment(DD)DegreeNodevelopmentModerateDevelopmentDevelopmentStrongDevelopmentExtremeDevelopmentIndex2233430~33~33~33~33~3555555552ResultsForillustrativepurposes,the2009resultsarepresentedinthemajorityofthemaintext.For245clarifythebackgrounddatasetsofthewholeresearch,thefulldataset(2004,2009,and2015)isprovidedinAppendixA.andtheelaborationofexpertsteamandquestionnaireformareinAppendixB.2.1EcologicalindictorsTheoverallperformanceofthemixedGinkgosystemswashigherthanpureGinkgo(G)or250thecroppingsystem(W+P;Table4).Thecroppingsystemhadthelowestvaluesforairtemperature,andthehighestsoilerosionindicatorandlitterdecompositionrate;itstotalproductivitywasrankedinthemiddleofthefivesystems.TheG+Msystemhadthelowestproductivityandsoilfertilityvalues,andwassecondhighestinthesoilerosionindicator.Amongthreemixedsystems,theG+W+Pachievedthebestoverallperformance(weightedtotal),255followedbyG+R+P,andthenG+M.Tab.4DifferencesintheecologicalindicatorsamongfivedifferentGinkgoagroforestrysystemsin20092009G+R+PG+W+PG+MGW+PTheannualaveragetemperature(℃)20.54±0.1120.51±0.220.37±0.1720.71±0.2421.96±0.23Normalizedvalue0.530.530.540.510.39-2-1Annualsoilerosion(t·hm·a)16.32±1.5419.51±2.752.49±0.3328.25±2.1247.52±5.76Normalizedvalue0.690.6210.430Soilfertilityqualityindex(FI)0.510.440.680.290.45-2-1Totalplantproductivity(kg·hm·a)27510±318.6532539.7±455.9912427.9±208.674815.7±90.222444.5±159.02Normalizedvalue0.8210.2700.64-8-
中国科技论文在线http://www.paper.edu.cnLitterdecompositionrate46.56±5.8950.74±6.8142.58±3.3252.86±5.8462.59±4.33Normalizedvalue0.200.4100.511Weightedtotal0.550.600.500.350.50Note:Valuesaremean±SD(n=3).2.2Economicindicators260ThemixedGinkgo-cropsystems,G+R+PandG+W+P,hadhighertotalincome,netincomeandNPVvaluescomparedwiththeothersystems(Table5).TheGsystemhadthelowestperformanceofalleconomicindicators.Althoughthecoppingsystem(W+P)hadthebestperformanceonthepaybackperiodofinvestment,itseconomicrevenueswerelowerthanthoseofthemixedGinkgosystems.G+W+PperformedbetterthanG+R+P(thoughnotalwaysbymuch),265whilethelatteroutperformedG+M.Tab.5DifferencesintheeconomicalindicatorsamongfivedifferentGinkgoagroforestrymodelsin20092009G+R+PG+W+PG+MGW+P-2-1Income(ThousandYuan·hm·a)4.88±0.355.72±0.703.57±0.452.58±0.613.13±0.19Normalizedvalue0.7310.3200.18-2-1NetIncome(ThousandYuan·hm·a)3.70±0.224.49±0.122.89±0.302.17±0.272.05±0.19Normalizedvalue0.6810.350.050Thepaybackperiodofinvestment(Ic=0.1)4.35±0.154.19±0.2017.67±0.25>370±0Normalizedvalue0.880.890.5201NPV(Ic=0.1)12.83±0.8914.01±0.743.69±0.12-3.25±0.3510.36±1.77Normalizedvalue0.9310.4000.79IRR0.44±0.030.47±0.010.14±0.050.06±0.01>1Normalizedvalue0.410.430.0801Weightedtotal0.730.860.320.010.59Note:Valuesaremean±SD(n=3).2.3Socialindicators270Withthesocialindicators,themixedsystemshadbetterperformanceonfourindicators(LER,opportunitiesofemployment,valueofgoods,andvarietyofproducts)thanthosefromthepureforestry(G)andcropping(W+P)systems(Table6).TheGandG+Msystemshadthehighestrankingforagriculturalproducts.TheG+W+PandG+R+PshowedoverallbetterthantheG+Msystem.275Tab.6DifferencesinthesocialindicatorsinfivedifferentGinkgoagroforestrymodelsin20092009G+R+PG+W+PG+MGW+PLER1.78±0.121.81±0.081.73±0.051±01±0Normalizedvalue0.9610.9000-1Opportunitiesofemployment(10thousandYuan·a)0.28±0.010.28±0.030.22±0.010.1±0.040.2±0.03Normalizedvalue110.6700.56Therateofagriculturalproducts0.85±00.8±01±01±00.75±0Normalizedvalue0.390.19110-9-
中国科技论文在线http://www.paper.edu.cnValueofgoods(10thousandYuan)4.84±0.315±0.724.43±0.442.85±0.562.62±0.16Normalizedvalue11.070.820.100Varietyofproducts3±03±02±01±02±0Normalizedvalue110.500.5Weightedtotal0.870.850.780.220.21Note:Valuesaremean±SD(n=3).2.4IntegratedindicatorsTheG+W+PsystemhadthehighestHDvalues,followedcloselybytheG+R+Psystem(Figure4).Themonoculturesystems(GandW+P)hadthelowestDDvalues(0.41and0.80,280respectively).G+W+PhadthehighestDDvalue(1.35),followedbyG+R+P(1.26)andG+M(0.98).a.HDforGb.HDforG+W+P285c.HDforG+R+Pd.HDforG+M-10-
中国科技论文在线http://www.paper.edu.cne.HDforCropsFig.4Equilateraltrianglesofthethreesustainabilitysubsystems,ecological(Ec),economic(E),andsocial(S)forGinkgo(a),Gingko,wheatandpeanut(b),Ginkgo,rapeseedandpeanut(c),Ginkgoandmulberry(d),and290agriculturalcrops(e).Theredtrianglesubscribesthevaluesforeachsubsystem,andtheredcrossisitscorrespondingcentroid(whichdefinestheharmonydegree)(seetext).2.5IndicatorchangeovertimeTable7showsthechangesinHDforthefivesystemsoverthreeperiods,2004,2009,and2014,whileFigure5showsthecorrespondingchangesinDD.Themixedsystems(G+R+PandG295+W+P)hadthehighestHDandDDvalues.Incontrast,theGsystemreceivedthelowestDDandhaddecliningHDvaluesoverthethreeperiods.Thecroppingsystem(W+P)hadsuitableHDvalues,butitsDDvalueswerelowerthanthosefromthemixedsystemsG+R+PandG+W+P,alongwithadecliningtrendovertime.TheG+MsystemhadlowerandvariableHDandDDvalues,ascomparedtothosefromtwomixedagroforestrysystems.300Tab.7DynamicchangesofHarmonydegree(HD)indifferentsystemsinthreetimeperiodsHDG+R+PG+W+PG+MGW+P20040.536±0.1560.449±0.1170.728±0.070.702±0.0960.61±0.11320090.678±0.0660.703±0.1250.552±0.0830.658±0.0490.604±0.06520140.712±0.1260.793±0.0740.719±0.1360.512±0.0610.76±0.110Note:Valuesaremean±SD(n=3).-11-
中国科技论文在线http://www.paper.edu.cnG+R+PG+W+P1.4G+MGW+P,R+P1.21.00.80.6DD(DevelopmentDegree)0.4200420092014YearFig.5DynamicchangesofDevelopmentDegree(DD)indifferentsystemsinthreetimeperiods3053Discussion3.1ComparisonsofindicatorsintheGinkgoagroforestrysystemsResultsindicatethatthemixedGinkgoagroforestrysystems,G+R+PandG+W+P,returnedthehighestoverallbenefit.Intermixingtreesandunderstoryvegetationaddstostructuraldiversity,increasedleafareaindexand,consequently,enhancedtotalproductionandassociated310economic-socialbenefits.Inaddition,soilerosioncontrol,bufferingofmicroclimatechangesandincreasingnutrientcyclingarebetter,ascomparedtothemonoculturesystems.ThereisevidencetoshowthattotalsoilcarbonandsoilorganiccarboncanalsobeaugmentedinGinkgo[9,12,14]agroforestrysystems.Furthermore,themixedsystemsappeartobetterintegrateecological,economicandsocialelements,asreflectedintheirhighharmonyanddegreeofdevelopment(HD315andDD,respectively).Agroforestrysystemsarealsogenerallyrecognizedashavingincreased[6,13,14]biodiversity.Themonoculturesystems(G,andW+P)hadthelowestoverallperformance,thoughtheyreceivedrelativelyhighvaluesinafewindicators(Tables4-6).Theecologicalproblemsassociatedwithmonocultureforestrysystemsarewelldocumented,andincludelowbiodiversity,[32-36]320long-termyielddecline,diseasesusceptibility,insectoutbreaks,andreducedsoilfunction.Agriculturalcroppingsystemsnormallyhavethequickesteconomicreturn,butothereconomicvaluesinadditiontotheirsocialvalues,arerelativelylow.Hence,theyoftenrequiregovernmentsubsidiestoremainviable,whichmaybewhyChinahasimplementedaprogramtoreturnsome[37]agriculturelandstoforests.325ThemixedG+Msystemhadthelowestsoilerosion,butitseconomicandsocialbenefitsrequirearelativelylongertimetoberealized.TheirHDandDDvalueswerethereforerelativelylow.Consequently,thissystemmayhavelimitedappealindevelopingcountries.3.2ApplicationofHDandDDforintegratedassessmentChinahasanationalpolicytopromoteeconomicdevelopmentwhileprotectingthe[38]330ecologicalenvironment.Tohelpachievethisgoal,effortshavebeenorientedtowardsameansoftransitioningfromtraditionalmethodsofresourceconsumptiontoasustainabledevelopment[38,39]model.Inthatregard,theHarmonyDegree(HD)reflectsthebalancebetweenthethreesystems,suchthatHDfortheagroforestrysystems,G+R+P,G+W+P,increasedprogressively,whilethatforthepureforestsystemdecreased.Thecroppingsystemsshowedfluctuationsinthe335HD,andadeclineinDD.Thus,thesetwointegratedindicatorsprovideausefulandimportant-12-
中国科技论文在线http://www.paper.edu.cnmeansofassessingwhetherornotagivenmanagementsystemissustainable.[22][22]YuanappliedthesametypeofanalysistoapureplantationforestfarminSouthChina,butonlyforasinglestandage.Here,wehavethebenefitofmultiplemeasurementsfromdifferentsystemsandatdifferentages.Thisisimportantbecause,asFigure6indicates,HDvariesbyage340andplantingsystem.Intheagroforestrysystems,G+W+PandG+R+P(Figure6a,b,respectively),HDmovestowardsthecenteroftheconcentriccircles,indicatingincreasingorderovertime(seeTable2).InpureGinkgo(Figure6c),however,HDmovesintheoppositedirection,indicatingatrendtowardsincreasingdisorder.Thecroppingsystem(Figure6d)tendedtohaveahighereconomicscorebutalower345ecologicalscore.IthasrelativelyhigherHDbuttheDDforthissystemtendedtodecrease(Figure5).TrendsintheHDfortheG+Msystemtendedtofluctuateamongthethreeages(Figure6e).TheHDandDDindicatorsareusefulinassessingwhetheragivenmanagementsystemcanbeconsideredassustainableornot.Akeycomponent,however,istoensuretheseindicatorsarecalculatedasatemporalsequence.Inthatrespect,itappearsthatconvertingmonoculturepractices350(eitherpureGinkgoorcropping)intoagroforestryisamuchbettermeansofimprovingeconomicreturnswhilebalancingecologicalconsiderations.EcEc0.10.90.10.90.20.80.20.80.30.70.30.7000.10.10.40.20.60.40.20.60.30.30.40.40.50.50.50.50.50.50.60.60.70.70.60.80.40.60.80.40.703170.90.90.535560.70.67750.30.70.44860.7930.30.712080.80.20.80.20.90.10.90.10.10.20.30.40.50.60.70.80.9ESE0.10.20.30.40.50.60.70.80.9Sa.DynamicchangesofHDforG+W+Pb.DynamicchangesofHDforG+R+PEcEc0.10.90.10.90.20.80.20.80.30.70.30.7000.10.10.40.20.60.40.20.60.30.30.40.40.50.50.50.50.50.603580.50.60.60.607510.70.70.60.80.40.756810.60.80.40.90.90.70.702220.30.70.30.65860.511530.80.20.80.20.90.10.90.10.10.20.30.40.50.60.70.80.9ES0.10.20.30.40.50.60.70.80.9ES355c.DynamicchangesofHDforGd.DynamicchangesofHDforCrops-13-
中国科技论文在线http://www.paper.edu.cnEc0.10.90.20.80.30.700.10.40.20.60.30.40.50.50.50.60.70.60.80.40.90.70.30.728430.715790.80.20.551520.90.10.10.20.30.40.50.60.70.80.9ESe.DynamicchangesofHDforG+MFig.6HarmonyDegree(HD)calculationsin2004,2009,and2014forfiveplantingsystems.3603.3TheimportanceofutilizingGinkgoagroforestrysystemWhatarethepotentialbenefitsofconvertingallmonocultureGinkgoforestsinJiangsuprovincetothebestmixedGinkgoagroforestrysystem(G+W+P)?Accordingtoprovincial[28][40]forestryinventorydata,therearecurrently61,482haofGinkgomonocultureforests.ConvertingalloftheseforeststoG+W+Pwouldincreaseannualnetincomeby23,200Yuanper365ha,foranannualnetincomeincreaseof1426.4millionYuan.Benefitswouldvarywidelyacrosstheprovince,however,dependingtheratioofmonoculturetomixedplantations.Forexample,theratiois214:1inthevicinityofSuzhoucityand34:1nearNanjingcity.AroundTaizhoucity(whereourstudywaslocated),theratiois23:1.IfmonocultureforestswereconvertedtotheG+Msystem,annualrevenueperhectarecouldincreaseby38%,butcouldbedoubledunderthe370G+W+Psystem.Inaddition,completeconversiontoG+W+Pwouldenhanceecologicalbenefits;forexample,areductioninsoilerosionfrom46.1to9.74t/m2·a.Ifsuitableagroforestrysystemscanbeidentifiedandimplemented,itispossibletorelievepovertyandenhanceeconomicandsocialbenefits,whileprotectingenvironmentalvalues.BesidesGinkgo,othersystemscouldbeevaluatedwiththeapproachusedhere.Itisencouragingthatin375manydevelopingcountriesandregions,thereistypicallyabroadrangeofpotentialcombinationsoftreespeciesandagriculturalcropsavailableforevaluationandtesting.Ourstudyalsodemonstratestheutilityofapplyingvariousandintegratedindicatorstoassessandcompareperformanceamongdifferentsystems.Selectingwhichindicatorstoincludeintheanalysisischallenging,however,andshouldbeconsideredasanincrementalprocessinformedby380accumulatedresearchandknowledge.OurindicatorswerederivedusingtheAnalyticalHierarchy[24]Process(AHP)andDelphimethod,whichlargelyreflectedwhatwasbestknownatthetimetheworkwasundertaken.Otherrepresentativeindicators(e.g.,floralandfaunalbiodiversity)shouldbeconsideredif/whenrelevantdataareavailable.4Conclusions385Aseriesofecological,economic,andsocialindicators,alongwithtwointegrativeindicators,HarmonyDegree(HD)andDevelopmentDegree(DD),wereusedtoevaluatethreeGinkgo-basedagroforestrysystems,Ginkgoalone,andanagriculturalcroppingsystem.Weconcludethat,(i)theGinkgoagroforestrysystemsperformedbetteroverallthaneitherofthemonoculturesystems,(ii)the-14-
中国科技论文在线http://www.paper.edu.cnbenefitsofagroforestryarerobustacrossarangeofindicatorsandshowedfurtherimprovementover390time,and(iii)agroforestrysystemscanbedevelopedthatbalanceenvironmentalprotectionwitheconomicandsocialobjectives.AcknowledgementsTheauthorsacknowledgethefinancialsupportofthePriorityAcademicProgrammerDevelopmentofJiangsuHigherEducationInstitutions(PAPD)inNanjingForestryUniversity,andthe395specializedresearchfundfordoctoralprogramofhighereducationinChina(20133204130001),generalfinancialgrantfromtheChinaPostdoctoralScienceFoundation(2016M601822).TheauthorsaregratefultoalltheresearchmembersintheGinkgoresearchteamfortheirlong-termdatacollection.AppendixATableA1TheeffectsonecologicalindicatorsindifferentGinkgoagroforestrymodelsin20042004G+R+PG+W+PG+MGW+PTheannualaveragetemperature(℃)21.5221.6220.907521.3821.8175Normalizedvalue0.4930.4850.5480.5060.467-2-1Annualsoilerosion(t·hm·a)36.3235.5115.7438.6542.14Normalizedvalue0.2200.25110.1320Soilfertilityqualityindex(FI)0.3950.4070.560.320.474-2-1Totalplantproductivity(kg·hm·a)2410523974106941786209367Normalizedvalue0.1080.1070.04301Litterdecompositionrate58.6755.7443.2552.8662.59Normalizedvalue0.7970.64600.4971Weightedtotal0.400.380.4380.2980.59400TableA2TheeffectsoneconomicalindicatorsindifferentGinkgoagroforestrymodelsin20042004G+R+PG+W+PG+MGW+P-2-1Income(ThousandYuan·hm·a)4.885.723.572.583.47Normalizedvalue0.73210.31600.283-2-1NetIncome(ThousandYuan·hm·a)2.042.211.720.391.07Normalizedvalue0.90710.729700.3717Thepaybackperiodofinvestment(Ic=0.1)4.354.1917.672>370Normalizedvalue0.8820.8870.52201NPV(Ic=0.1)12.8314.013.69-3.2510.36Normalizedvalue0.93110.40200.788IRR0.440.470.140.064>1Normalizedvalue0.4060.4290.07601Weightedtotal0.730.860.320.010.59TableA3TheeffectsonsocialindicatorsindifferentGinkgoagroforestrymodelsin20042004G+R+PG+W+PG+MGW+PLER1.081.11.0311-15-
中国科技论文在线http://www.paper.edu.cnNormalizedvalue11.250.37500-1Opportunitiesofemployment(10thousandYuan·a)0.280.280.220.10.2Normalizedvalue110.66700.556Therateofagriculturalproducts0.790.72110.7542Normalizedvalue0.250110.1221Valueofgoodscommodityvalue(10thousandYuan)2.042.2091.7170.3931.067Normalizedvalue0.90710.72900.371Varietyofproducts33212Normalizedvalue110.500.5Weightedtotal0.830.850.650.20.31TableA4TheeffectsonecologicalindicatorsindifferentGinkgoagroforestrymodelsin20142014G+R+PG+W+PG+MGW+PTheannualaveragetemperature(℃)21.7121.6721.7922.3623.48Normalizedvalue0.5480.5530.5410.4840.374-2-1Annualsoilerosion(t·hm·a)9.749.682.4510.8846.1Normalizedvalue0.8330.834310.8070Soilfertilityqualityindex(FI)0.6150.570.6090.5410.43-2-1Totalplantproductivity(kg·hm·a)3300635612167841264724041Normalizedvalue0.88710.18000.496Litterdecompositionrate45.6942.8740.5452.8662.59Normalizedvalue0.2340.10700.5591Weightedtotal0.620.610.470.480.46TableA5TheeffectsoneconomicalindicatorsindifferentGinkgoagroforestrymodelsin20142014G+R+PG+W+PG+MGW+P-2-1Income(ThousandYuan·hm·a)5.4315.7214.4433.068853.346Normalizedvalue0.89110.518100.105-2-1NetIncome(ThousandYuan·hm·a)4.0985.0963.74162.871.813Normalizedvalue0.3740.6780.2650-0.322Thepaybackperiodofinvestment4.3464.1917.672>370(Ic=0.1)Normalizedvalue0.8830.8870.52201NPV(Ic=0.1)12.82614.0093.69-3.24710.358Normalizedvalue0.93110.40200.788IRR0.4440.4650.1350.064>1Normalizedvalue0.4060.4280.075901Weightedtotal0.700.800.3600.51TableA6TheeffectsofsocialindicatorsindifferentGinkgoagroforestryon20142014G+R+PG+W+PG+MGW+PLER1.641.471.2911Normalizedvalue10.730.4500-16-
中国科技论文在线http://www.paper.edu.cn-1Opportunitiesofemployment(10thousandYuan·a)0.210.210.140.10.2Normalizedvalue110.3600.91Therateofagriculturalproducts0.910.8110.7542Normalizedvalue0.630.19110Valueofgoodscommodityvalue(10thousandYuan)3.7304.0773.7413.0691.368Normalizedvalue0.871.000.880.630Varietyofproducts33212Normalizedvalue110.500.5Weightedtotal0.900.780.640.330.28405AppendixB[23]TheGinkgoPlantingExpertSystem(GPES)wasdevelopedwithDreamweaverCS4,SQLServer2008,MATLAB2014,PrologandFlex3.TheoperatingsystemwassetwithWindowsServer2003.ThedevelopmentplatformwasASP.NET2.0.Eachexpertworkingfortheginkgoplantationfarmcanloginthesystemandfillthequestionnaireformtoprovidetheiropinionsaboutpreselected410indicators.ThesystemisinChinese,formoredetailitcanbefoundinreference23.ThequestionnairehasfivequestionsforeachpreselectedindicatorasshowninTableB1.Eachexpertanswersthequestionsbycheckinganappropriateboxintheform.ThenallofthedataareusedasthebasisforAnalyticalHierarchyProcess(AHP)andDelphimethod.Thedetailedexplanationscanbefoundinthe[22,24]references.415TableB1AsampledquestionnaireforselectingindicatorsNo.QuestionforPreselectedIndicatorsAnswertobechoseCloselyandunambiguouslyrelatedtothe1=poor2=fair3=satisfactoryassessmentgoal?4=good5=verygoodDirectly/obviously/intuitively/logicallylinkedtocriterionortosustainability.Easytodetect,recordandinterpret?Easytoget1=poor2=fair3=satisfactorytheinformation,straightforward?4=good5=verygoodProvidesasummaryorintegrativemeasure?1=poor2=fair3=satisfactorySummarizes/integratesalotofinformation,isit4=good5=verygoodinformationefficient?Haveacleardefinition?0=yes1=noImportantand,therefore,selectedas‘priority’0=notaccepted1=acceptedforfurtherevaluationReferences[1]PanY.,BirdseyR.A.,FangJ.,HoughtonR.,KauppiP.E.,KurzW.A.,PhillipsO.L.,ShvidenkoA.,LewisS.420L.,CanadellJ.G.,CiaisP.,JacksonJ.B.,PacalaS.,McGuireA.D.,PiaoS.,RautiainenA.,SitchS.,andHayesD.:Alargeandpersistentcarbonsinkintheworld"sforests,Science,2011,333:988-993.[2]FAO.2011.StateoftheWord"sForests2011.Rome.www.fao.org/docrep/013/i2000e/i2000e00.htm.[3]FAO.2010,GlobalForestResourcesAssessment2010-mainreport.FAOForestryPaperNo.163.Rome.www.fao.org/docrep/013/i757e/i1757e00.htm.425[4]Costanza,R.,Ecosystemservices:Multipleclassificationsystemsareneeded.BiologicalConservation,2008,141:350-352.[5]FortierJ.,TruaxB.,GagnonD.,LambertF.,PotentialforHybridPoplarRiparianBufferstoProvideEcosystemServicesinThreeWatershedswithContrastingAgriculturalLandUse.Forests,2016,7,37.[6]PangA.Q.,NubergI.EconomicevaluationoftheagroforestrycomplexsysteminChina.JournalofNatural430Resources,1997,12(2):176-182.-17-
中国科技论文在线http://www.paper.edu.cn[7]PerryJ.,LojkaB.,QuinonesRuizL.G.,VanDammeP.,HouškaJ.,FernandezCusimamaniE.,HownaturalForestConversionAffectsInsectBiodiversityinthePeruvianAmazon:CanAgroforestryHelp?Forests2016,7,82.[8]ChengPeng,BiologicalproductivityandecologicaleffectsforGinkgoagroforestrysystems,2010,Ph.D.435Thesis,NanjingForestryUniversity,China,inChinese.[9]WanF.X.,ChenP.,SoilenzymeactivitiesunderagroforestrysystemsinNorthernJiangsuprovince.ForestScienceandPractice,2004,6(2):21-26.[10]LiWenhua.Agro-ecologicalfarmingsystemsinChina.Unesco,2001.[11]ChenLei,TheeffectsofcarbonstocksandsoilcarboncycleinGinkgoagroforestrysystems,2013,Ph.D.440Thesis,NanjingForestryUniversity,China,inChinese.[12]WangG.,WelhamC.,FengC.,EnhancedsoilcarbonstorageunderagroforestryandafforestationinsubtropicalChina.Forests,2015,6:2307-2323.[13]GeorgeT.S.,GregoryP.J.,WoodM.,Phosphataseactivityandorganicacidsinrhizosphereofpotentialagroforestryspeciesandmaize.SoilBiologyandBiochemistry,2002,34:1487-1494.445[14]CaoFuliang,J.P.Kimmins,J.R.Wang,CompetitiveinteractionsinGinkgoandcropspeciesmixedagroforestrysystemsinJiangsu,China,Agroforest,System,2012,84:401-415[15]KoundouriP.,KerRaultP.,PergamalisV.,SkianisV.,SouliotisI.,Developmentofanintegratedmethodologyforthesustainableenvironmentalandsocio-economicmanagementofriverecosystems,ScienceofTheTotalEnvironment,2016,540:90-100,http://dx.doi.org/10.1016/j.scitotenv.2015.07.082.450[16]DailyG.,Nature"sServices:SocietalDependenceonNaturalEcosystems.1997,Washington,DC,IslandPress[17]TerisA.vanBeek,PaolaMontoro,ChemicalanalysisandqualitycontrolofGinkgobilobaleaves,extracts,andphytopharmaceuticals,JournalofChromatographyA,2009,1216(11):2002-2032[18]HoffenL.P.,SäumelIna,Orchardsforediblecities:Cadmiumandleadcontentinnuts,berries,pomeand455stonefruitsharvestedwithintheinnercityneighborhoodsinBerlin,Germany,EcotoxicologyandEnvironmentalSafety,2014,101:233-239,http://dx.doi.org/10.1016/j.ecoenv.2013.11.023.[19]CaoFuliang,EcolgoicalbasisforGinkgoagroforestrysystems,2007,Chinaforestrypublishinghouse,Ph.D.Thesis,TheUniversityofBritishColumbia,Canada,2004.[20]Xu,Jian,Evaluationofgrowthbenefitsindifferentcomprehensivemanagementpatternsofginkgoandcitrus,460NonwoodForestResearch,2006,24(2):32-34.inChinese.[21]TianYalin,PhysiologicalandEcologicalEffectsofGinkgo-teaAgroforestrySystems,2012,Ph.D.Thesis,NanjingForestryUniversity,China,inChinese.[22]SunYuan,DevelopmentofanAssessmentSystemforSustainableForestManagementinSouthChina,2011,LogosVerlagBerlin,Ph.D.Thesis,FreiburgUniversity,Germany,2011465[23]GuWeijiang,DesignandDevelopmentofGinkgoPlantingExpertSystem,2010,MasterThesis,NanjingForestryUniversity,China,inChinese.[24]Hwang,C.L.,Lin,M.J.,1987:Groupdecisionmakingundermultiplecriteria:methodsandapplications[M].Springer,Berlin[25]NielsSchwab,UdoSchickhoff,ElkeFischer,Transitiontoagroforestrysignificantlyimprovessoilquality:A470casestudyinthecentralmid-hillsofNepal,Agriculture,Ecosystems&Environment,2015,205(7):57-69,ISSN0167-8809,http://dx.doi.org/10.1016/j.agee.2015.03.004.[26]WangG.,CaoF.,IntegratedevaluationofsoilfertilityinGinkgo(GinkgobilobaL.)agroforestrysystemsinJiangsu,China.AgroforestrySystems,2011,83(1):89-100.[27]ForestsituationofJiangsuProvincein2015http://www.jsforestry.gov.cn/art/2016/4/19/art_11_87612.html.475(InChinese)[28]PrabhuR.,CarolJ.P.,DudleyG.,1999:CIFOR,C&IToolbox,GuidelinesforDeveloping,TestingandSelectingCriteriaandIndicatorsforSustainableForestManagement.http://www.cifor.org/acm/pub/toolbox.html(accessedonJune2010)[29]ZagonariFabio,Usingecosystemservicesindecision-makingtosupportsustainabledevelopment:Critiques,480modeldevelopment,acasestudy,andperspectives,ScienceofTheTotalEnvironment,2016,Volumes548-549,pp.25-32,http://dx.doi.org/10.1016/j.scitotenv.2016.01.021.[30]Haken,H.,Graham,R.,1971:Synergetik-DieLehrevomZusammenwirken.Umschau6.191[31]LogsdonRebeccaA.,IndrajeetChaubey,Aquantitativeapproachtoevaluatingecosystemservices,EcologicalModeling,2013,257:57-65,http://dx.doi.org/10.1016/j.ecolmodel.2013.02.009.485[32]Shrestha,P.,Seiler,J.R.,Strahm,B.D.,Sucre,E.B.,Leggett,Z.H.SoilCO2EffluxandRootProductivityinaSwitchgrassandLoblollyPineIntercroppingSystem.Forests2016,7,221.[33]Bayrak,M.M.;Marafa,L.M.TenYearsofREDD+:ACriticalReviewoftheImpactofREDD+onForest-DependentCommunities.Sustainability2016,8,620.[34]DavidI.Forrester,HansPretzsch.TammReview:Onthestrengthofevidencewhencomparingecosystem490functionsofmixtureswithmonocultures,ForestEcologyandManagement,356(15):41-53,http://dx.doi.org/10.1016/j.foreco.2015.08.016.[35]WilseyChadB.,TempleS.A..TheEffectsofCroppingSystemsonAvianCommunitiesinCacaoandBananaAgro‐ForestrySystemsofTalamanca,CostaRica.Biotropica,43.1(2011):68-76.[36]ZhengJ,WeiX,LiuY.ReviewofregionalcarboncountingmethodsfortheChinesemajorecological495engineeringprograms.JournalofForestryResearch,2016,27(4):1-12.[37]BennettMT.China"sslopinglandconversionprogram:Institutionalinnovationorbusinessasusual.EcologicalEconomics,2008,65(4):699-711.-18-
中国科技论文在线http://www.paper.edu.cn[38]MaHuimin,DingYang.Aphylogeneticanalysisofecological,economicalandsocialcoordinateddevelopmentofaregion.JournalofShanghainormaluniversity(philosophyandsocialsciencesedition),2016,45500(06):49-57.inChinese[39]SuJing,HuZongyi,TangLiwei.Thegeographicdistributioncharactersanddynamicevolutionforthecoordinationdegreeofenergy-economic-environmental(3E)inChina.EconomicGeography,2013,33(9):19-30.inChinese[40]LiSigang,JiangTingting.AnalysisonsituationandcharacteristicofforestresourcesinJiangsuProvince,505JournalofJiangsuForestryScience&Technology,2011,3817705):34-37.inChinese基于生态原理的亚热带可持续农林复合经营评价112345510孙圆,曹福亮,WELHAMClive,PELZR.Dieter,WEIXiaohua,陈雷,杨6青(1.南京林业大学南方协同创新中心,南京210037;2.不列颠哥伦比亚大学林学院林业资源管理部,温哥华BCV6T1Z1;3.弗莱堡大学环境与自然资源学院,弗莱堡79108;5154.不列颠哥伦比亚大学地球与环境科学学院,温哥华BCV6T1Z1;5.南京林业大学林学院,南京210037;6.南京林业大学信息学院,南京210037)摘要:热带和亚热带国家的森林由于贫穷和环境退化而面临严重的压力。为了对森林采取有效的经营和保护措施,必须考虑社会、经济和生态方面的协同作用。本文的目的是综合研究520组长期(1994-2015)实验研究的结果,在银杏农林复合系统中实现可持续的目标,并证明它的潜力,同时讨论其在热带和亚热带国家的广泛应用。研究比较了三种银杏农林复合系统的生态、经济、社会指标,同时选用纯林和纯农经营系统作为参照。评价的结果采用了两个综合指标:协调度(HD)和发展度(DD),用来显示三个子系统指标的综合性能。结果显示银杏-小麦-花生(G+W+P)和银杏-油菜-花生(G+R+P)是最佳农林复合系统,其经营方525式可以实现经济发展和环境保护,在亚热带地区实现农林复合系统的可持续发展。关键词:银杏;指标;林产品;协调度;发展度中图分类号:S75-19-'
您可能关注的文档
- 基于分层技术的快速最大方差展开算法及其在过程监测中的应用.pdf
- 基于区域映射与全概率模型的多示例图像检索方法.pdf
- 基于卫星测高回波波形的南极海域重力异常研究.pdf
- 基于异丙醇锆阴极修饰层的高效聚合物太阳能电池.pdf
- 基于机器学习的信号测向方法.pdf
- 基于格兰杰因果关系磁刺激穴位对亚健康失眠的脑功能网络分析.pdf
- 基于正弦波波形的电网电压监测.pdf
- 基于毛细管结构的热式风速传感器设计.pdf
- 基于活性的格尔德霉素探针的设计及其抗肿瘤靶点的研究.pdf
- 基于移动设备多传感器融合的室内定位系统.pdf
- 基于组氨酸的药物基因载体在癌症诊疗中的应用.pdf
- 基于能量峰值检测的UWB导频模式估计算法.pdf
- 基于负载均衡的VANET跨层贪婪路由算法.pdf
- 基于逆向技术的采煤机导向滑靴设计优化.pdf
- 多功能高强度水凝胶的构建及其生物医学应用.pdf
- 多小区协作上行链路系统中一种以用户为中心的动态分簇算法.pdf
- 大豆花叶病毒抗性鉴定及抗病种质筛选.pdf
- 富氢盐水对东莨菪碱诱导大鼠干眼模型眼表保护作用.pdf
相关文档
- 施工规范CECS140-2002给水排水工程埋地管芯缠丝预应力混凝土管和预应力钢筒混凝土管管道结构设计规程
- 施工规范CECS141-2002给水排水工程埋地钢管管道结构设计规程
- 施工规范CECS142-2002给水排水工程埋地铸铁管管道结构设计规程
- 施工规范CECS143-2002给水排水工程埋地预制混凝土圆形管管道结构设计规程
- 施工规范CECS145-2002给水排水工程埋地矩形管管道结构设计规程
- 施工规范CECS190-2005给水排水工程埋地玻璃纤维增强塑料夹砂管管道结构设计规程
- cecs 140:2002 给水排水工程埋地管芯缠丝预应力混凝土管和预应力钢筒混凝土管管道结构设计规程(含条文说明)
- cecs 141:2002 给水排水工程埋地钢管管道结构设计规程 条文说明
- cecs 140:2002 给水排水工程埋地管芯缠丝预应力混凝土管和预应力钢筒混凝土管管道结构设计规程 条文说明
- cecs 142:2002 给水排水工程埋地铸铁管管道结构设计规程 条文说明