

- 430.32 KB
- 2022-04-22 13:46:00 发布

- 1、本文档共5页,可阅读全部内容。
- 2、本文档内容版权归属内容提供方,所产生的收益全部归内容提供方所有。如果您对本文有版权争议,可选择认领,认领后既往收益都归您。
- 3、本文档由用户上传,本站不保证质量和数量令人满意,可能有诸多瑕疵,付费之前,请仔细先通过免费阅读内容等途径辨别内容交易风险。如存在严重挂羊头卖狗肉之情形,可联系本站下载客服投诉处理。
- 文档侵权举报电话:19940600175。
'中国科技论文在线http://www.paper.edu.cnChina’sgrowinginfluenceinAsia-Pacificstockmarkets:#Evidencefromspillovereffectsandmarketintegration*5GONGPu,ZOUDong(SchoolofManagement,HuazhongUniversityofScienceandTechnology)Abstract:ThisstudyexaminesChina’sinfluenceintheAsia-Pacificstockmarketsbyfocusingonspillovereffectsandmarketintegration.ThisstudyemploysthegeneralizedvectorautoregressiveframeworktoexaminespillovereffectsamongthemainAsia-Pacificstockmarkets.Themulti-factor10R-squaredmeasureisemployedtoexaminethemarketintegrationofChinesestockmarket.TheresultsindicatethatspillovereffectsandmarketintegrationtendtoincreaseandfinancialcrisesandtheongoingfinancialliberalizationofChinahavestrengthenedspillovereffectsandmarketintegration.Keywords:Spillovereffects;Marketintegration;Financialliberalization;Financialcrisis150IntroductionTheincreasinginfluenceofChinaintheregionalandglobaleconomy,specificallyintheaspectsoftradeandinvestment,hasgainedconsiderableattentiongiventhecountry"sremarkableeconomicdevelopment.ThisinfluenceisparticularlysignificantintheAsia-Pacificregionbecauseoftheclosespatialandeconomicconnectionamongcountries.However,China’s20influenceinthefinancialsectorisnotcomparabletothatofrealeconomy.InternationalfinancialtransactionsinChinaarestillaffectedbystate-controlledbanksandfinancialmarkets,heavily[1]managedassetprices,andamyriadofregulationsandcontrols.However,financialcrisesandtheongoingfinancialliberalizationofChinastrengthenedthecountry"sroleattheregionalandgloballevels.ThisstudyattemptstoshedlightonChina’sinfluenceonAsia-Pacificstockmarkets25byfocusingonspillovereffectsandmarketintegration.In2015,theworldhaswitnessedthedramaticincreaseanddecreaseofChina’sstockmarketinamatteroffewmonths.ThestockmarketbubbleburstinJune2015.Thefollowingmonthsweremarkedbycontinuousturbulenceinthemarket.Accordingtothestatistics,athirdofthevalueofA-sharesintheShanghaiStockExchangewaslostwithinonemonthaftertheevent.The30valuesofChinesestockmarketscontinuedtodropdespiteeffortsofthegovernmenttoreducethefall.TheChinesestockmarketturbulencehasattractedconsiderableattentionfromdomesticandglobalinvestors.Asia-Pacificstockmarkets,suchasHongKong,Japan,Taiwan,Korea,Singapore,andAustralia,wereheavilyaffectedbythiseventduetothespatialcloseness.Anincreasingbodyofevidencesuggeststhattheinternationalfinancialmarketsare35becomingincreasinglycorrelatedandinteracted,whichindicatesthatacertainmarketwillbemoreaffectedbyothermarketsandviceversa.Ontheregionalorgloballevel,morecorrelatedandinteractedmeansthatacertainmarketwillbemoreintegratedwiththeregionalorglobalmarket.Evidencealsoshowsthatmarketinteractionandco-movementmaybeenhancedduring[2][3][4][5][6]thecrisisperiod.Therefore,the2015-2016Chinesestockmarketturbulence,together40withthe2007-2009financialcrisisandEuropeandebtcrisiswillofferusanuniquenaturalexperimentforinvestigatingthedynamicspillovereffectsandmarketintegrationamongAsia-Pacificstockmarkets.[7][8][9]BasedontheseriesstudiesofDieboldandYilmaz,thisstudyemploysthegeneralizedvectorautoregressiveframeworktoexaminethespillovereffectsamongtheAsia-Pacificstock45markets,especiallythespillovereffectsbetweentheChineseandotherstockmarketsinthisFoundations:DoctoralProgramofHigherEducationofChinaFoundation(No.20110142110068)Briefauthorintroduction:GongPu(1954-),Male,Professor,FinancialEngineering.E-mail:gongpu@hust.edu.cn-1-
中国科技论文在线http://www.paper.edu.cnregion.Thepreciseandseparatemeasuresofreturnspilloversandvolatilityspilloversareformulatedandexamined.Inthisframework,thenon-crisisandcrisisepisodes,includingtrendsandburstsinspilloverscanbestudied.Inordertosupportthefoundresultsofspillovers,the[10]multi-factorR-squaredmeasureproposedbyPukthuanthongandRollisemployedtoexamine50thestockmarketintegrationbetweentheChineseandotherstockmarketsinthisregion.Toestimatethecommonregionalfactors,theprincipalcomponentanalysis(PCA)isused.1LiteraturereviewToaddresstheproblemofvariableorderingintraditionalvariancedecompositions,Diebold[8][7]andYilmazextendthestudyofDieboldandYilmaztoageneralizedvectorautoregressive55framework;inthisframework,forecast-errorvariancedecompositionsareinvarianttovariableordering.Moreover,themeasuresofboththetotalanddirectionalvolatilityspilloversareproposed.Sincethismethodisintuitiveandsimpletoimplementtostudythespillovereffects,[3][9][11][12]considerableattentionhasbeenreceivedfromresearchers.[8]InadditiontothemethodofDieboldYilmaz,methodsbasedonGARCHmodelarealso[13]60popularamongresearchers.Forinstance,inanearlierstudy,NgconstructsavolatilityspillovermodelwhichallowstheunexpectedreturnofanyparticularPacific–Basinmarketbedrivenbyalocalidiosyncraticshock,aregionalshockfromJapanandaglobalshockfromtheUS.Byusingthismodel,themagnitudeandchangingnatureofvolatilityspilloversfromJapanandtheUStothePacific–Basinequitymarketscanbeinvestigated.ByusingamultivariateVAR-GARCH[14]65model,JohanssonandLjungwallexplorespillovereffectsamongthegreaterChinastockmarkets.Thesecondstrandofliteraturefocusesonmarketintegration.Giventhepoormeasureofthe[10]correlationacrossmarkets,PukthuanthongandRolldevelopanewintegrationmeasurebasedontheexplanatorypowerofamulti-factormodel.Theyfindthat,formostcountries,therehas70beenamarkedincreaseinmeasuredintegrationoverthepastthreedecades,butthisisnotindicatedbycorrelationsamongcountryindices.Sincethen,considerableattentionhasbeen[5][6][15][16]receivedfromresearchers.SeveralstudieshavefocusedonassessingmarketintegrationinEastAsiastockmarketand[2][4][17][18]investigatingtherelationshipbetweenintegrationandfinancialcrises.Huyghebaertand[2]75Wang(2010)examinetheintegrationandcausalityofinterdependenciesamongstockmarketsinsevenmajorEastAsiancountriesbefore,during,andafterthe1997–1998Asianfinancialcrisisusingdailydata.TheyfindthattherelationshipsamongEastAsianstockmarketsaretimevarying.[17]Tam(2014)examinesEastAsianequitymarketlinkagesinandoutoftheAsianandglobal[4]financialcrisesusinganoveleconometricapproach.Wangexaminestheintegrationand80causalityofinterdependenciesamongsixmajorEastAsianstockexchanges,whilealsoconsideringtheirinteractionswiththeUSAbeforeandduringthe2007–2009globalfinancial[18]crisis.BoubakriandGuillauminstudythedynamicsofregionalfinancialintegrationinEastAsiaoverthe1990-2010period.Inaddition,severalstudieshavefocusedonthemarketintegrationoftheChinesestock[19]85marketwithregionalorglobalmarkets.BurdekinandSiklosapplyavarietyofshort-runandlong-runtimeseriestechniquestostudythelevelofintegrationoftheChinesestockmarketwith[1]otherregionalandglobalmarkets.GlickandHutchisonpresentempiricalevidenceonassetmarketlinkagesbetweenChinaandAsiaandhowtheselinkageshaveshiftedduringandafterthe[20]globalfinancialcrisisof2008–2009.Chienetal.examinethedynamicprocessofconvergence90amongcross-borderstockmarketsinChinaandASEAN-5countriesusingrecursivecointegration-2-
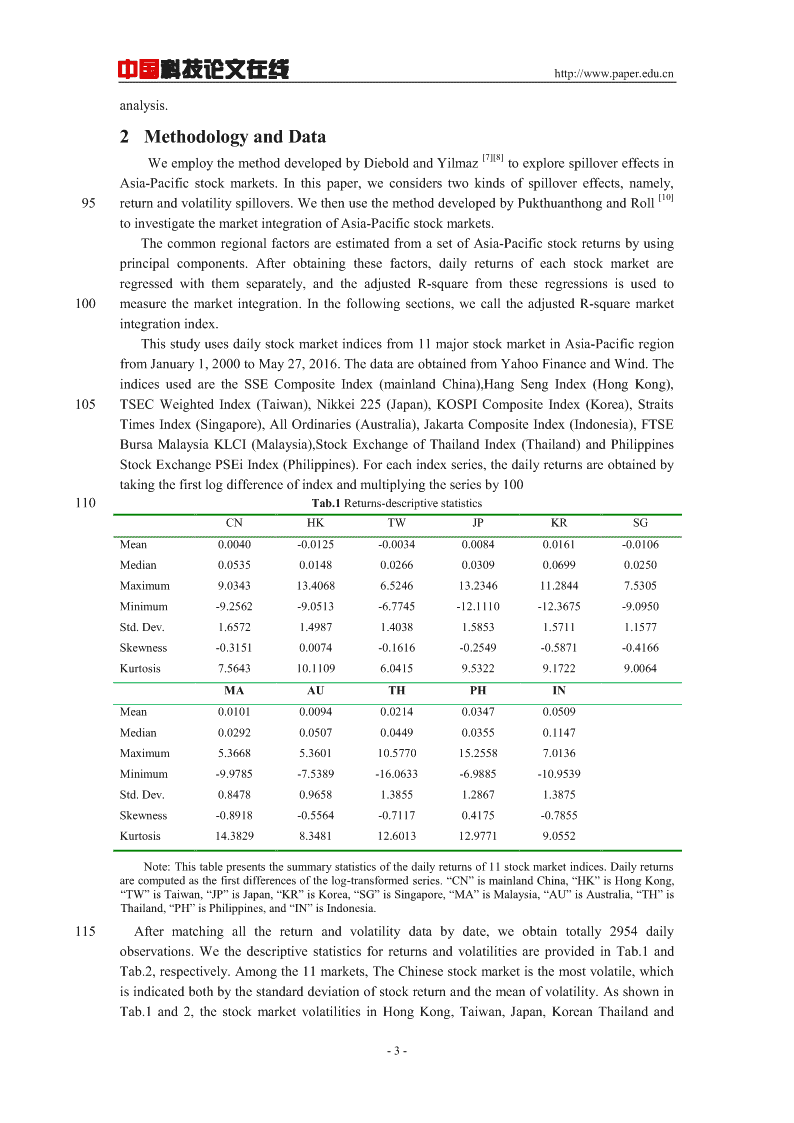
中国科技论文在线http://www.paper.edu.cnanalysis.2MethodologyandData[7][8]WeemploythemethoddevelopedbyDieboldandYilmaztoexplorespillovereffectsinAsia-Pacificstockmarkets.Inthispaper,weconsiderstwokindsofspillovereffects,namely,[10]95returnandvolatilityspillovers.WethenusethemethoddevelopedbyPukthuanthongandRolltoinvestigatethemarketintegrationofAsia-Pacificstockmarkets.ThecommonregionalfactorsareestimatedfromasetofAsia-Pacificstockreturnsbyusingprincipalcomponents.Afterobtainingthesefactors,dailyreturnsofeachstockmarketareregressedwiththemseparately,andtheadjustedR-squarefromtheseregressionsisusedto100measurethemarketintegration.Inthefollowingsections,wecalltheadjustedR-squaremarketintegrationindex.Thisstudyusesdailystockmarketindicesfrom11majorstockmarketinAsia-PacificregionfromJanuary1,2000toMay27,2016.ThedataareobtainedfromYahooFinanceandWind.TheindicesusedaretheSSECompositeIndex(mainlandChina),HangSengIndex(HongKong),105TSECWeightedIndex(Taiwan),Nikkei225(Japan),KOSPICompositeIndex(Korea),StraitsTimesIndex(Singapore),AllOrdinaries(Australia),JakartaCompositeIndex(Indonesia),FTSEBursaMalaysiaKLCI(Malaysia),StockExchangeofThailandIndex(Thailand)andPhilippinesStockExchangePSEiIndex(Philippines).Foreachindexseries,thedailyreturnsareobtainedbytakingthefirstlogdifferenceofindexandmultiplyingtheseriesby100110Tab.1Returns-descriptivestatisticsCNHKTWJPKRSGMean0.0040-0.0125-0.00340.00840.0161-0.0106Median0.05350.01480.02660.03090.06990.0250Maximum9.034313.40686.524613.234611.28447.5305Minimum-9.2562-9.0513-6.7745-12.1110-12.3675-9.0950Std.Dev.1.65721.49871.40381.58531.57111.1577Skewness-0.31510.0074-0.1616-0.2549-0.5871-0.4166Kurtosis7.564310.11096.04159.53229.17229.0064MAAUTHPHINMean0.01010.00940.02140.03470.0509Median0.02920.05070.04490.03550.1147Maximum5.36685.360110.577015.25587.0136Minimum-9.9785-7.5389-16.0633-6.9885-10.9539Std.Dev.0.84780.96581.38551.28671.3875Skewness-0.8918-0.5564-0.71170.4175-0.7855Kurtosis14.38298.348112.601312.97719.0552Note:Thistablepresentsthesummarystatisticsofthedailyreturnsof11stockmarketindices.Dailyreturnsarecomputedasthefirstdifferencesofthelog-transformedseries.“CN”ismainlandChina,“HK”isHongKong,“TW”isTaiwan,“JP”isJapan,“KR”isKorea,“SG”isSingapore,“MA”isMalaysia,“AU”isAustralia,“TH”isThailand,“PH”isPhilippines,and“IN”isIndonesia.115Aftermatchingallthereturnandvolatilitydatabydate,weobtaintotally2954dailyobservations.WethedescriptivestatisticsforreturnsandvolatilitiesareprovidedinTab.1andTab.2,respectively.Amongthe11markets,TheChinesestockmarketisthemostvolatile,whichisindicatedbothbythestandarddeviationofstockreturnandthemeanofvolatility.AsshowninTab.1and2,thestockmarketvolatilitiesinHongKong,Taiwan,Japan,KoreanThailandand-3-
中国科技论文在线http://www.paper.edu.cn120Indonesiaarealsoveryhigh.Forthismarkets,thestandarddeviationsofreturnareabove1.38,themeansofthevolatilitiesareabove15%.Amongallthemarkets,Malaysiastockmarketistheleastvolatile.Tab.2Volatilities-descriptivestatisticsCNHKTWJPKRSGMean21.4116.3315.4216.2018.3513.61Median17.6713.7513.0414.1614.9911.24Maximum122.65119.3493.75149.72193.02159.77Minimum2.983.100.003.023.390.00Std.Dev.13.859.929.419.6612.799.45Skewness2.392.961.933.083.274.00Kurtosis11.7618.809.3024.5524.9037.02MAAUTHPHINMean10.1710.5315.7712.4516.50Median8.318.9513.5810.8813.70Maximum82.60109.27213.4276.34105.69Minimum1.310.003.140.000.00Std.Dev.6.846.8710.046.7810.68Skewness2.833.765.172.132.52Kurtosis17.9933.8268.8511.9713.32Note:Thistablepresentsthesummarystatisticsoftheannualizeddailypercentstandarddeviationsof11125stockmarketindices.Dailyreturnsarecomputedasthefirstdifferencesofthelog-transformedseries.“CN”ismainlandChina,“HK”isHongKong,“TW”isTaiwan,“JP”isJapan,“KR”isKorea,“SG”isSingapore,“MA”isMalaysia,“AU”isAustralia,“TH”isThailand,“PH”isPhilippines,and“IN”isIndonesia.3EmpiricalresultsandanalysisInthissection,wefirstpresentthemainresultsandanalysisofbothreturnandvolatility130spilloversamongAsia-PacificstockmarketsinageneralizedVARframework.Then,wetrytointerprettheexistingpatternofspilloversfromtheviewofmarketintegration.Asthefinancialmarketsexperiencedevolutionandturbulenceduringtheyearsinoursample,January2000-May2016,itisimportantforustoevaluatethechangingstatusoftheChinesestockmarketsintheAsia-Pacificmarkets.Toaddressthisissue,weuserolling-sampletostudythe135spilloverdynamics,whichishelpfulforustoassesstheextentandnatureofspillovervariationovertime.Inthissection,the500-daysrollingsamplesareusedtoestimateourmodels.Thetotalreturnandvolatilityspilloversamongthe11Asia-PacificmarketsduringthesampleperiodarepresentedinFig.1.First,weexaminethedynamicsoftotalreturnspillovers.Thereturnspilloverindexdisplaysanincreasingtrendbeforelate2012andafterearly2015,andadecreasing140trendbetweenlate2012andearly2015.Before2004,thetotalreturnspilloverindexisblow50%,indicatingthattheAsia-Pacificstockmarketsarelesscorrelated.Afterthemiddleof2004,thereturnspilloverindexexperiencesdramaticincreasingandmaintainsarelativehighlevelduringSeptember2008andJuly2013.Aftertwoyears’decreasing,theindexincreasesagain.Adifferentpatternisobservedfortotalvolatilityspillovers.Thevolatilityspilloverindexhas145awiderangeandresponsetoeconomicevents,especiallyforthethreemajorevents:subprimemortgagecrisisstartinginJuly–August2007,theEuropeandebtcrisisdeterioratingbetween2010and2011andthestockmarketturbulenceinChinastartinginJune2015.Duringtheseevents,thevolatilityspilloversdisplayclearbursts.Fortheperiodbetween2002and2009,ourresultsare-4-
中国科技论文在线http://www.paper.edu.cn[3]consistentwiththestudyofZhouetal..80ReturnSpillovers75VolatilitySpillovers706560Index(%)5550454002-0903-0904-0905-0906-0907-0808-0809-0810-0811-0812-0813-0714-0715-0716-07EndingDateofWindow150Fig.1TotalreturnandvolatilityspilloversTakingboththereturnandvolatilityspilloversintoconsideration,thereturnandvolatilityspilloversareofthesamemagnitudeformostofthesampleperiod.Whatisdifferentfromthe[7]studyofDieboldandYilmazisthat,bothreturnandvolatilityspilloversdisplayanincreasing155ordecreasingtrendformostofthesampleperiod.ThetotalspilloverplotsdescribetheoverallspilloversintheAsia-Pacificstockmarkets,butdiscardthedirectionalinformationamongdifferentmarkets.Inordertostudythespillovereffectofspecificmarketonotherstockmarkets,thedirectionalspilloversshouldbeestimatedandused.Inthissection,wefocusonthedirectionofthespilloversbetweentheChineseandotherstock160markets.6FromOthersToOhters543Index(%)21002-0903-0904-0905-0906-0907-0808-0809-0810-0811-0812-0813-0714-0715-0716-07EndingDateofWindowFig.2DirectionalreturnspilloversbetweentheChineseandotherstockmarkets-5-
中国科技论文在线http://www.paper.edu.cn2.521.510.50Index(%)-0.5-1-1.5-2-2.502-0903-0904-0905-0906-0907-0808-0809-0810-0811-0812-0813-0714-0715-0716-07EndingDateofWindowFig.3NetreturnspilloverfromtheChinesestockmarkettoothers165ThedirectionalreturnspilloversbetweentheChineseandotherstockmarketsarepresentedinFig.2.ThebluelinedenotesthespilloverfromtheChinesestockmarkettoothers.TheredlinedenotesthespilloverfromotherstoChinesestockmarket.ThenetdirectionalreturnspilloverfromtheChinesestockmarkettoothersispresentedinFig.3.Forthedirectionalspilloverplots,thespilloverfromtheChinesestockmarkettoothersand170thespilloverfromotherstotheChinesestockmarketsshowthesimilarpattern.Thetwodirectionalspilloverindicesremainatalowlevelbefore2005,lessthan1%.However,after2005,theindicescontinuetoincreasebeforetheendof2013.Afteraroundoneandhalfyears’decease,theindicesreversetoincreasethendecreasebeforethemiddleof2015.ThedirectionalspilloverindexfromotherstoChinesestockmarketreachesthehighestvaluebetween2013and2014,175whereasthedirectionalspilloverindexformtheChinesestockmarkettoothersreachesthehighestvalueinJune2016andremainsatahighlevelafterward.ThesefindingsindicatethattheChinesestockmarkethasbecomeincreasinglyimportantinAsia-Pacificequitymarketssince2005duetofinancialliberalizationofChina.Thefindingsareconsistentwithpreviousliterature.[2]Forinstance,HuyghebaertandWangfindthatthemainlandChinesestockmarketisisolated[17]180fromtheothermarketsbetween1992and2003.TamfindsthelinkagebetweentheChineseequitymarketandotherEastAsianequitymarketsistime-varying.Ononehand,theChineseequitymarketisisolatedbecauseoftherestrictionsonforeigninvestmentandcapitalcontrolsinplace.Ontheother,Chinahasbecomemoreintegratedwithindividualmarkets,whichisalso[19][3][1]supportedbyBurdekinandSiklos,Zhouetal.andGlickandHutchison.185WhatismoreinterestingandattractiveisthatthespilloversfromtheChinesestockmarkettoothersexceedthespilloversfromotherstotheChinesestockmarketafterJune2015.PriortoJune2016,theChinesestockmarketismainlydrivenbyotherstockmarketsintheregion,whereastheChinesestockmarketdrivesotherssincethestockmarketturbulencestartingfromJune2015.ThisfindingsuggeststhattheChinesestockmarketisbecomingtheinformationgiverratherthan190receiver.-6-
中国科技论文在线http://www.paper.edu.cn18FromOthersToOthers16141210Index(%)8642002-0903-0904-0905-0906-0907-0808-0809-0810-0811-0812-0813-0714-0715-0716-07EndingDateofWindowFig.4DirectionalvolatilityspilloversbetweentheChineseandotherstockmarkets161412108Index(%)6420-202-0903-0904-0905-0906-0907-0808-0809-0810-0811-0812-0813-0714-0715-0716-07EndingDateofWindowFig.5NetvolatilityspilloverfromtheChinesestockmarkettoothers195ThedirectionalvolatilityspilloversbetweentheChineseandotherstockmarketsarepresentedinFig.4.ThenetdirectionalvolatilityspilloverfromtheChinesestockmarkettoothersarepresentedinFig.5.Duringmostoftheperiod,thevolatilityspilloverfromtheChinesestockmarkettoothersislargerthanthespilloverfromotherstotheChinesestockmarketwiththeexceptionbetween2013and2014,indicatingthattheinfluenceoftheChinesestockmarkethas[3]200increasedgraduallysince2005.ThisfindingisconsistentwiththestudyofZhouetal..It’s-7-
中国科技论文在线http://www.paper.edu.cnnoteworthythatthenetvolatilityspilloverindexexperiencesmainly4clustersofburst.Thefirstclusterisintheperiodbetween2004and2005whichiscausedbythefinancialliberalizationofChina.Thesecondoneisintheperiodbetween2007and2008duringtheglobalfinancialcrisis.Thethirdoneisintheperiodbetween2010and2013duringtheEuropeandebtcrisis.Thelastone205isintheperiodbetween2014and2015duetotheChinesestockmarketturbulence.WefindthattheEuropeandebtcrisishaslesseffectonthelinkagebetweentheChinesestockmarketandotherstockmarketintheAsia-Pacificregion.Tobeconsistentwiththedynamicsofspillovers,the250-daysrollingsamplesareusedtocapturethedailytime-varyingdynamicsoftheintegrationprocess,whichissimilarbutlittle[10][15][5][15]210differentfromthestudyofPukthuanthongandRoll,Bergeretal.,Heetal.and[6]Lehkonen.ThedynamicsofthemarketintegrationprocessarepresentedinFig.6.Themarketintegrationindexremainsatalowlevelbefore2005whichisalmostblow0.05,andthenreachesapeakin2005.Afterashorttimeofdecrease,themarketintegrationindexcontinuestoincreasesince2007.215After2010,themarketintegrationindexstartstoincreaseonceagainandthenremainsatahighlevelwhichisabove0.3.Duringthetranquilperiodin2014,themarketintegrationindexdecreasesbutisstillabove0.15.Thisisduetothefactthat,thestockmarketstendtobeindependentformeachotheraundertranquilmarketcondition.AfterJune2015,themarketintegrationindexincreasesrapidlytothelevelabove0.3.Thesefindingsareconsistentwithour220findingsintheabovesections.0.40.350.30.250.2MarketIntegrationIndex0.150.10.05002-0903-0904-0905-0906-0907-0808-0809-0810-0811-0812-0813-0714-0715-0716-07EndingDateofWindowFig.6MarketIntegrationbetweenChineseandAsia-Pacificstockmarkets4ConclusionWiththeremarkableeconomicdevelopment,muchattentionhasbeenpaidtotheincreasing225influenceofChinaontheregionalandglobaleconomy,especially,intheaspectsoftradeandinvestment.ThisinfluenceisparticularlysignificantintheAsia-Pacificregionbecauseoftheclosespatialandeconomicconnection.Financialcrises,togetherwiththeongoingfinancialliberalizationofChina,havestrengthenedtheroleChinaplayinginregionalandgloballevel.This-8-
中国科技论文在线http://www.paper.edu.cnstudyattemptstoshedlightontheChina’sinfluenceintheAsia-Pacificstockmarketsbyfocusing230onspillovereffectsandmarketintegrationThisstudyemploysthevectorgeneralizedvectorautoregressiveframeworktoexaminethespillovereffectsamongtheAsia-Pacificstockmarkets,especiallythespillovereffectsbetweentheChineseandotherstockmarketsintheregion.Inordertosupportthefoundresultsofspillovers,themulti-factorR-squaredmeasureisemployedtoexaminethestockmarketintegrationbetween235Chinaandtheregion.Theprincipalcomponentanalysis(PCA)isusedtoestimatethecommonregionalfactors,TheresultsindicatethatboththespillovereffectsandmarketintegrationbetweentheChineseandotherstockmarketsinAsia-Pacificregiontendtoincreaseovermostofthestudyperiod.FinancialcrisesandtheongoingfinancialliberalizationofChinahavestrengthenedspillover240effectsandmarketintegration.Marketintegrationandreturnspilloverremainatalowlevelbefore2005andsubsequentlyreachesaclimaxin2005.Afterashorttimeofdecrease,theycontinuetoincreasesince2007.After2010,theystarttoincreaseonceagainandthenstaysatahighlevel.Duringthetranquilperiodin2014,marketintegrationandreturnspilloverstarttodecreasebutremainatahighlevel.Thisisduetothefactthat,thestockmarketstendtobeindependentform245eachotherunderatranquilmarketcondition.AftertheJune2015,theyincreasesrapidly.Inthisstudy,stockindicesfrom11marketsinAsia-Pacificregionisused.AsourfocusisontheinfluenceoftheChinesestockmarketinthisregion,wedidnotconsiderthestockmarketsatagloballevel.Thisareaisleftforfutureinvestigation.References250[1]GlickR,HutchisonM.China"sfinanciallinkageswithAsiaandtheglobalfinancialcrisis[J].JournalofInternationalMoney&Finance,2013,39(3):186-206.[2]HuyghebaertN,WangL.Theco-movementofstockmarketsinEastAsia:Didthe1997-1998Asianfinancialcrisisreallystrengthenstockmarketintegration?[J].ChinaEconomicReview,2008,21(1):98-112.[3]ZhouX,ZhangW,ZhangJ.VolatilityspilloversbetweentheChineseandworldequitymarkets[J].255Pacific-BasinFinanceJournal,2012,20(2):247-270.[4]WangL.WhomovesEastAsianstockmarkets?Theroleofthe2007-2009globalfinancialcrisis[J].JournalofInternationalFinancialMarketsInstitutions&Money,2014,28(1):182-203.[5]HeH,ChenS,YaoS,etal.Financialliberalisationandinternationalmarketinterdependence:EvidencefromChina"sstockmarketinthepost-WTOaccessionperiod[J].JournalofInternationalFinancialMarketsInstitutions260&Money,2014,33:434-444.[6]LehkonenH.StockMarketIntegrationandtheGlobalFinancialCrisis[J].ReviewofFinance,2015,19(5).[7]Diebold,F.X.,&Yilmaz,K..Measuringfinancialassetreturnandvolatilityspillovers,withapplicationtoglobalequitymarkets[J].TheEconomicJournal,2009,119(534),158-171.[8]Diebold,F.X.,&Yilmaz,K..Bettertogivethantoreceive:Predictivedirectionalmeasurementofvolatility265spillovers[J].InternationalJournalofForecasting,2012,28(1),57-66.[9]DieboldFX,YilmazK.Trans-AtlanticEquityVolatilityConnectedness:U.S.andEuropeanFinancialInstitutions,2004-2014[J].JournalofFinancialEconometrics,2015,14(1):nbv021.[10]PukthuanthongK,RollR.Globalmarketintegration:Analternativemeasureanditsapplication[J].JournalofFinancialEconomics,2009,94(2):214-232.270[11]TsaiIC.DynamicinformationtransferintheUnitedStateshousingandstockmarkets[J].NorthAmericanJournalofEconomics&Finance,2015,34:215-230.[12]ApostolakisG,PapadopoulosAP.Financialstressspilloversacrossthebanking,securitiesandforeignexchangemarkets[J].JournalofFinancialStability,2015,19:1-21.[13]AngelaNg.VolatilityspillovereffectsfromJapanandtheUStothePacific-Basin[J].JournalofInternational275MoneyandFinance,2000,19:207-233.[14]JohanssonAC,LjungwallC.SpilloverEffectsAmongtheGreaterChinaStockMarkets[J].WorldDevelopment,2009,37(4):839-851.[15]BergerD,PukthuanthongK,YangJJ.Internationaldiversificationwithfrontiermarkets[J].JournalofFinancialEconomics,2011,101(1):227-242.280[16]HeH,ChenS,YaoS,etal.StockmarketinterdependencebetweenChinaandtheworld:Amulti-factorR-squaredapproach[J].FinanceResearchLetters,2015,13:125-129.[17]TamPS.Aspatial-temporalanalysisofEastAsianequitymarketlinkages[J].JournalofComparativeEconomics,2014,42(2):304-327.[18]BoubakriS,GuillauminC.RegionalintegrationoftheEastAsianstockmarkets:Anempiricalassessment[J].-9-
中国科技论文在线http://www.paper.edu.cn285JournalofInternationalMoney&Finance,2015,57:136-160.[19]RichardC.K.Burdekin,PierreL.Siklos.Enterthedragon:InteractionsbetweenChinese,USandAsia-Pacificequitymarkets,1995-2010[J].Pacific-BasinFinanceJournal,2011,20(3):521-541.[20]ChienMS,LeeCC,HuTC,etal.DynamicAsianstockmarketconvergence:EvidencefromdynamiccointegrationanalysisamongChinaandASEAN-5[J].EconomicModelling,2015,51:84-98.290中国在亚太地区股票市场的影响力研究:来自溢出效应和市场一体化的证据龚朴,邹冬295(华中科技大学管理学院)摘要:本研究从溢出效应和市场一体化的视角的研究了中国在亚太地区股票市场的影响力。本研究在广义向量自回归模型框架下检验了亚太地区主要股票市场间的溢出效应。采用多元R方度量方法检验了中国股票市场与其他股票市场的市场一体化程度。研究结果表明,溢出效应和市场一体化程度呈现出上升的趋势,金融危机和中国金融自由化进程强化了溢出效应300和市场一体化程度。关键词:溢出效应;市场一体化;金融自由化;金融危机中图分类号:C93-10-'
您可能关注的文档
- AgTiO2纳米管阵列光电催化性能研究.pdf
- CFRP索在索桥结构中的应用和发展.pdf
- LMWOAs对溶解态菲和甲基菲生物降解过程影响的研究.pdf
- [AMIM][BF4]溶胶-凝胶固相微萃取涂层在水体中有机磷酸酯化合物测定中的应用.pdf
- 一个基于梯度提升决策树的商品推荐算法.pdf
- 一种初中数学知识本体的构建与评估.pdf
- 不同时程铅暴露对海马神经元AMPA受体表达的影响.pdf
- 不同面筋蛋白组分对面包品质的影响.pdf
- 两种硫氧化细菌CO2同化潜能解析及其影响因素.pdf
- 中韩贸易自由化的贸易效应评估.pdf
- 主导企业突破性技术与市场的共生演化--以格力电器为例.pdf
- 二苯甲烷二异氰酸酯的清洁合成反应过程研究.pdf
- 企业出口市场边界扩展的空间路径--企业海外集聚的价值.pdf
- 传统酸面团中抗霉菌乳酸菌的筛选及其在蒸蛋糕中的应用.pdf
- 低温辅助超声波诱导活的非可培养状态鼠伤寒沙门氏菌及复苏研究.pdf
- 光谱法研究不同粒径NAC-CdTe QDs对溶菌酶的毒性作用机制.pdf
- 全球价值链发展背景下中国自由贸易区伙伴选择.pdf
- 内源蛋白酶和微生物对冷藏河豚鱼质构软化的作用研究.pdf
相关文档
- 施工规范CECS140-2002给水排水工程埋地管芯缠丝预应力混凝土管和预应力钢筒混凝土管管道结构设计规程
- 施工规范CECS141-2002给水排水工程埋地钢管管道结构设计规程
- 施工规范CECS142-2002给水排水工程埋地铸铁管管道结构设计规程
- 施工规范CECS143-2002给水排水工程埋地预制混凝土圆形管管道结构设计规程
- 施工规范CECS145-2002给水排水工程埋地矩形管管道结构设计规程
- 施工规范CECS190-2005给水排水工程埋地玻璃纤维增强塑料夹砂管管道结构设计规程
- cecs 140:2002 给水排水工程埋地管芯缠丝预应力混凝土管和预应力钢筒混凝土管管道结构设计规程(含条文说明)
- cecs 141:2002 给水排水工程埋地钢管管道结构设计规程 条文说明
- cecs 140:2002 给水排水工程埋地管芯缠丝预应力混凝土管和预应力钢筒混凝土管管道结构设计规程 条文说明
- cecs 142:2002 给水排水工程埋地铸铁管管道结构设计规程 条文说明